The Culprit
Cyanobacteria or blue-green algae are not actually bacteria nor algae. All plants have chloroplasts, which seem to be descended from cyanobacteria ancient organisms. The evolution of cyanobacteria changed Earth’s early atmosphere from Reducing (no Oxygen) to Oxidizing. They may have been the first organisms that successfully performed photosynthesis. One species, prochlorococcus, is the most plentiful species on Earth (in the ocean) and produces 20% of Earth’s oxygen. However, several species (dolichospermum, woronichia, and microcystis) produce toxins that can harm people and animals such as fish and birds.

CONTRIBUTING TO THE SOLUTION
Cyanobacteria have different photosynthetic pigments than normal algae, and since different pigments can have different spectra and hyperspectral imaging (HSI) can distinguish different spectra in different pixels, potentially HSI can be used to identify and quantify harmful algal blooms. Prompt identification can improve efficacy of mitigation strategies. Headwall is working with experts to get ground truth to test this detection method.
BACKGROUND AND TECHNOLOGY
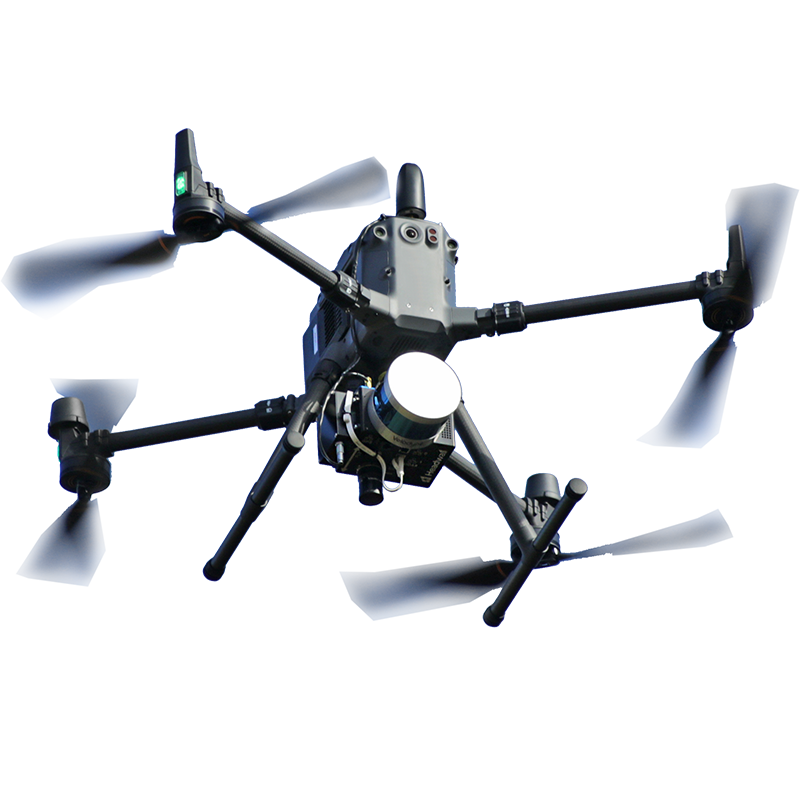
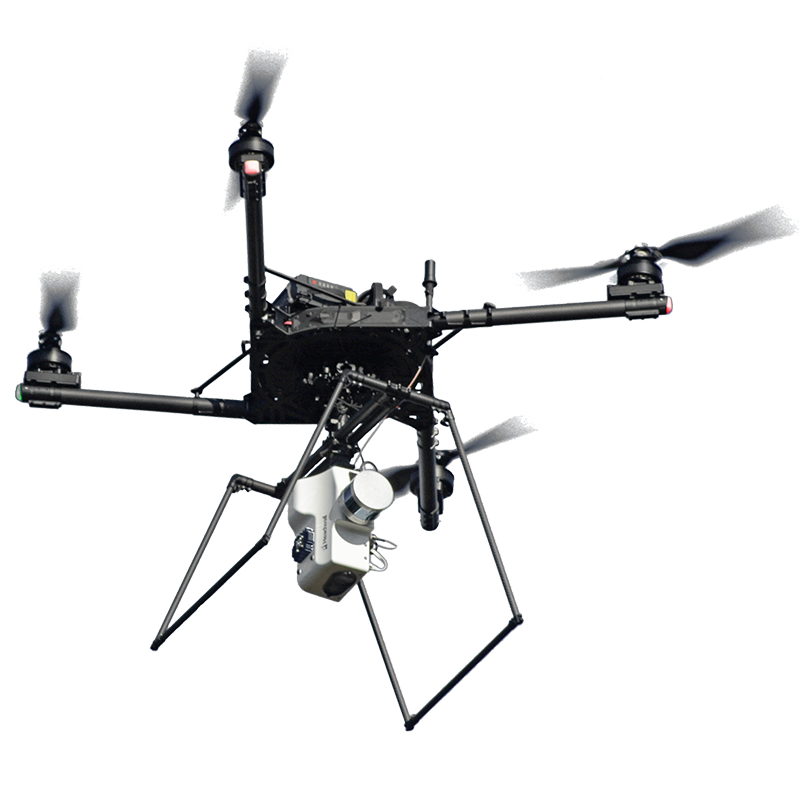
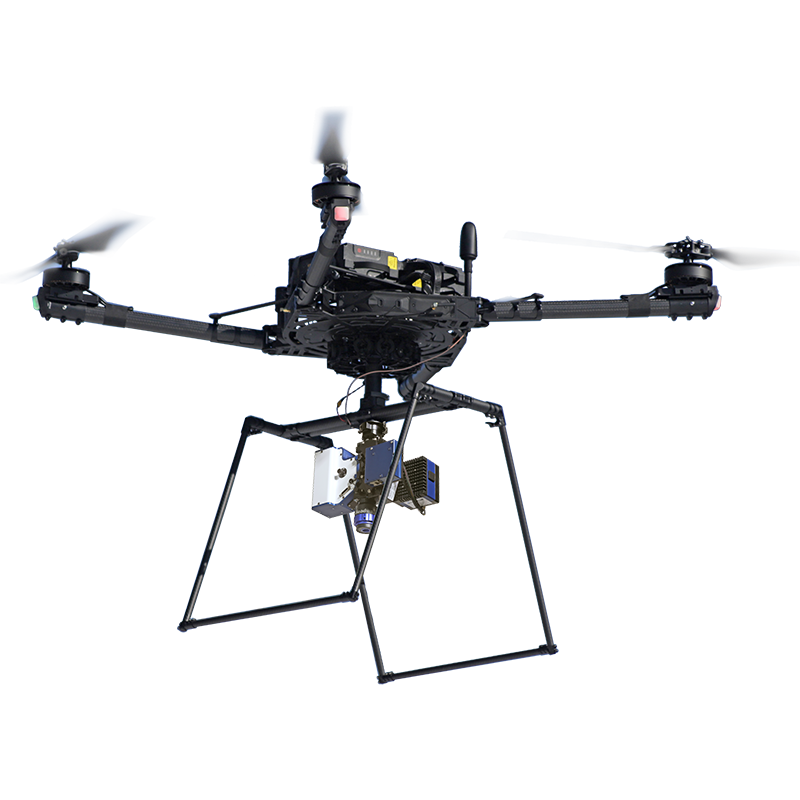
Santuit Pond is a located in Mashpee, Massachusetts and has been impacted by HABs for many years. Water quality is being monitored by several state, tribal, and local government agencies, academia, as well as by companies such as Coastal Ocean Vision and Headwall. Coastal Ocean Vision also maintains a number of HABStat sensors at fixed locations in the pond. Headwall’s technique of capturing full spectral data (hundreds of wavelengths) at each pixel from a lightweight UAV (unmanned aerial vehicle) is well documented. Combined with precise GPS coordinates and timestamps and available LiDAR (Light Detection And Ranging), a hyperspectral dataset was captured by a Headwall Nano-Hyperspec® VNIR sensor payload, along with very precise elevation information below the flight path of the DJI Matrice 300 UAV over Santuit Pond in Mashpee, Massachusetts.
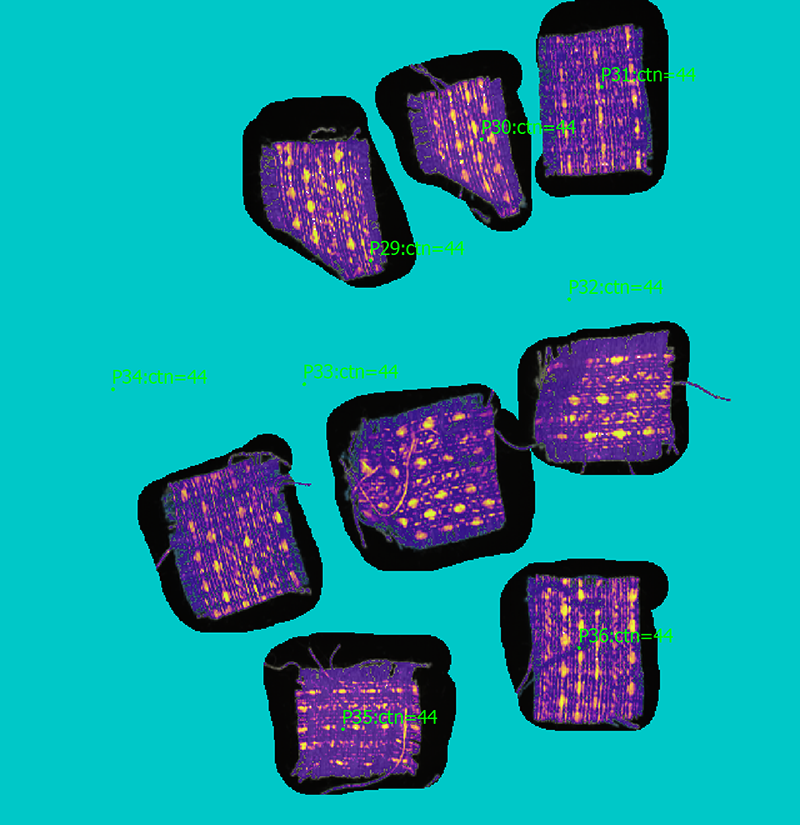
Simultaneous with the UAV flight, Headwall partner Coastal Ocean Vision operated a proprietary HABStat Raman Imaging Flow Cytometer in the water from a small boat. The HABStat system uses high-speed Raman Spectroscopy and strobed imaging to acquire Raman spectra and cell images simultaneously. The Raman spectra represent a molecular fingerprint of a cell along with quantification of pigmentation such as chlorophyll and phycocyanin, as well as toxin if present. Deep Learning AI combines the spectral and imaging data to classify cells to species in real time.

THE MISSION
A remote sensing mission was undertaken by Headwall and Coastal Ocean Vision in June, August, and November of 2022. The Headwall team flew its off-the-shelf, turnkey Nano-Hyperspec® VNIR sensor with LiDAR on a DJI Matrice 300 UAV. The payload package weighs less than 4 lbs, keeping total take-off weight well below the FAA’s Part 107 Small Unmanned Aircraft Rule. The Coastal Ocean Vision team operated a powered watercraft with a HABStat deployed in the water beside the hull. The drone flew a pre-programmed lawnmower pattern over the same area of Santuit Pond upon which the boat navigated.
The teams spent a few hours on June 21, August 15, and November 11, 2022 capturing data and documenting the mission. In November, the Mashpee Department of Natural Resources Harbormaster staff graciously assisted with a marine patrol boat and captain when the original boat was temporarily unavailable. All other aspects of the mission went smoothly.

SIMULTANEOUS DATA CAPTURE
The benefit of flying the drone while the boat navigated the pond was obtaining so-called ground truth data. Ground truth is information that is known to be true.
Measurements from the flow-cytometry system in the water were compared with the simultaneous remote measurements from the drone via HSI. Since both systems utilized very precisely timed GPS systems, instances when the drone was directly over the boat were noted and confirmed looking at the 3D LiDAR point cloud and the spectra of the boat itself!
RESULTS
CyanoHABS were at a low level in June when we conducted our first mission, but started increasing rapidly in early July, and reached intensive bloom conditions by mid-August during our second mission. The water was pea-soup green with a Sechi disk reading of < 5cm. Suddenly on August 28, the bloom crashed over an eight-hour period. This phenomena was noted by HABStats on the dock. Large 2-mm chytrids were attaching to the dolichospermum strands, possibly causing them to sink out of the water column.

As shown here (Fig. 5) each LiDAR point has a location and a timestamp. Coloring the point cloud by time allows determination of exact latitude, longitude and time of each boat image in the hyperspectral data. This allowed precise correlation between local hyperspectral classification and measurements from HABStats.
 Figure 6 is an RGB (conventional color) image from a Reflectance Image overlaid on Google Maps. Note the lighter and darker areas in the image. These are due to intermittent clouds changing the downwelling illumination. These intensity variations will affect the classification analysis.
Here you see a Full-Spectrum Reflectance orthomosaic classified with three HAB classes and two tree classes, generated from the data (Fig. 7). HAB classes are based on variations in apparent density of HAB in the RGB images.

Illumination variations due to clouds produce classification artifacts along flight lines. Note the reference spectra shown (Fig. 7) and the June RGB and false-color classified orthomosaic images (Fig. 8). The green vascular plant elodea choked the surface of the pond in many locations. It was so thick that it stalled the boat engine many times. Low levels of cyanoHABs fringed the pond around the coastline that was dominated by woronichia and classified as HAB2.

In contrast, the August classification image (Fig. 10) shows greatly increased presence of HABs. The November classification images show very little indication of cyanoHABs in the center of the pond but two HAB groups are seen scattered along the coastline on both east and west coasts. HABStats on the dock showed moderate levels of aphanizomenon and microcystis which was
classified as HAB1 and HAB2.